amazon_copurchases — Amazon co-purchasing network (2003)
- Description
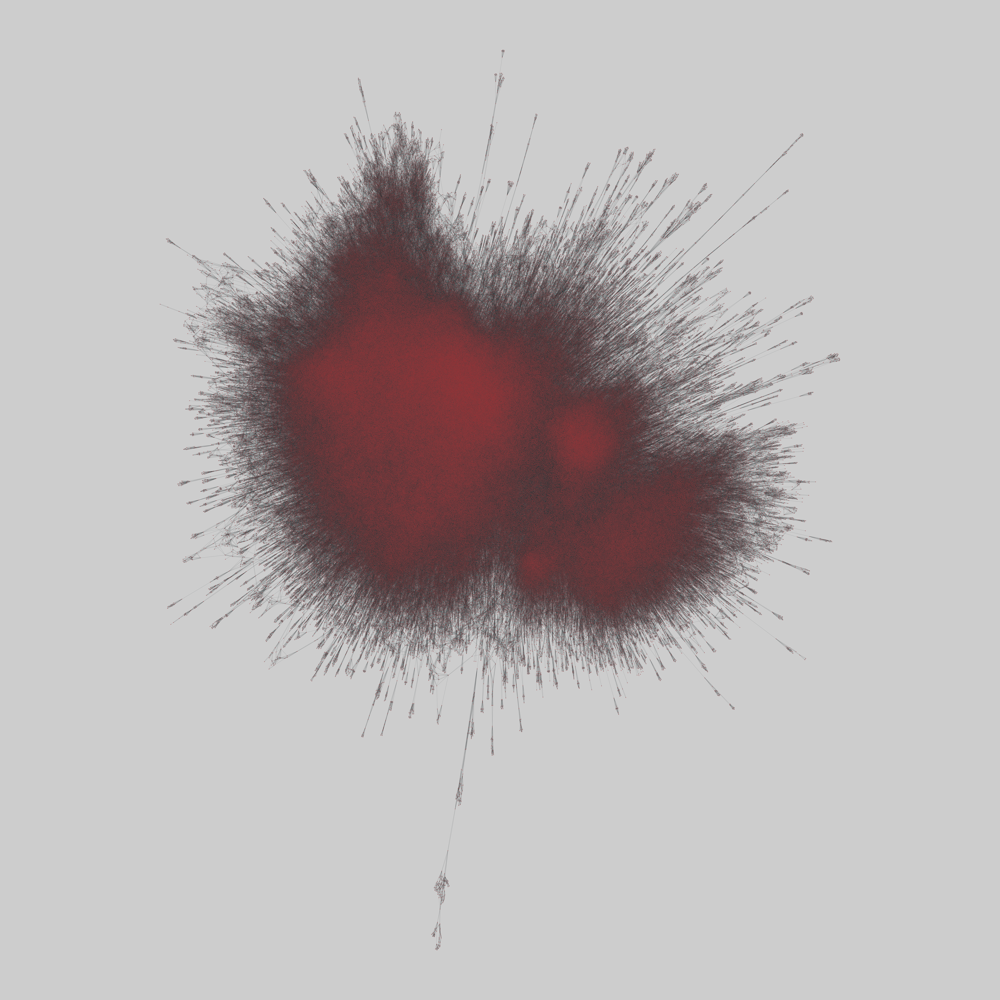
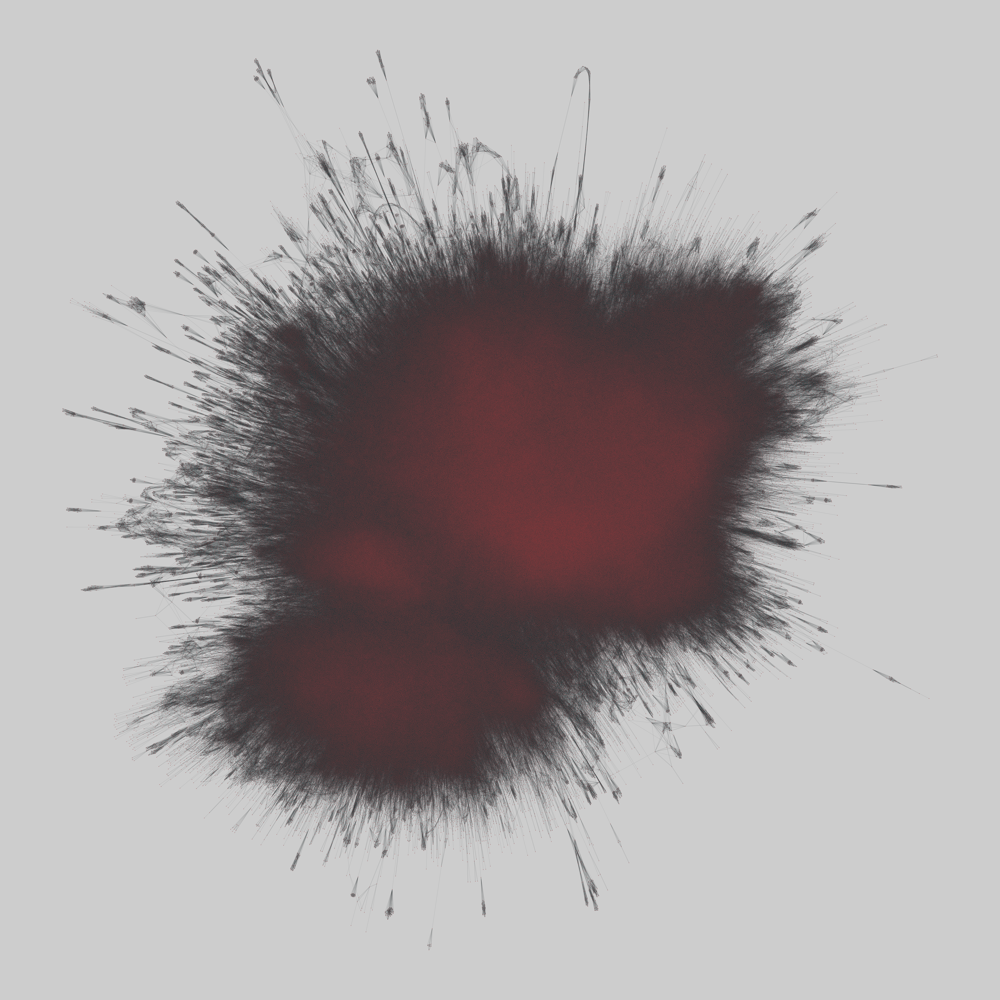
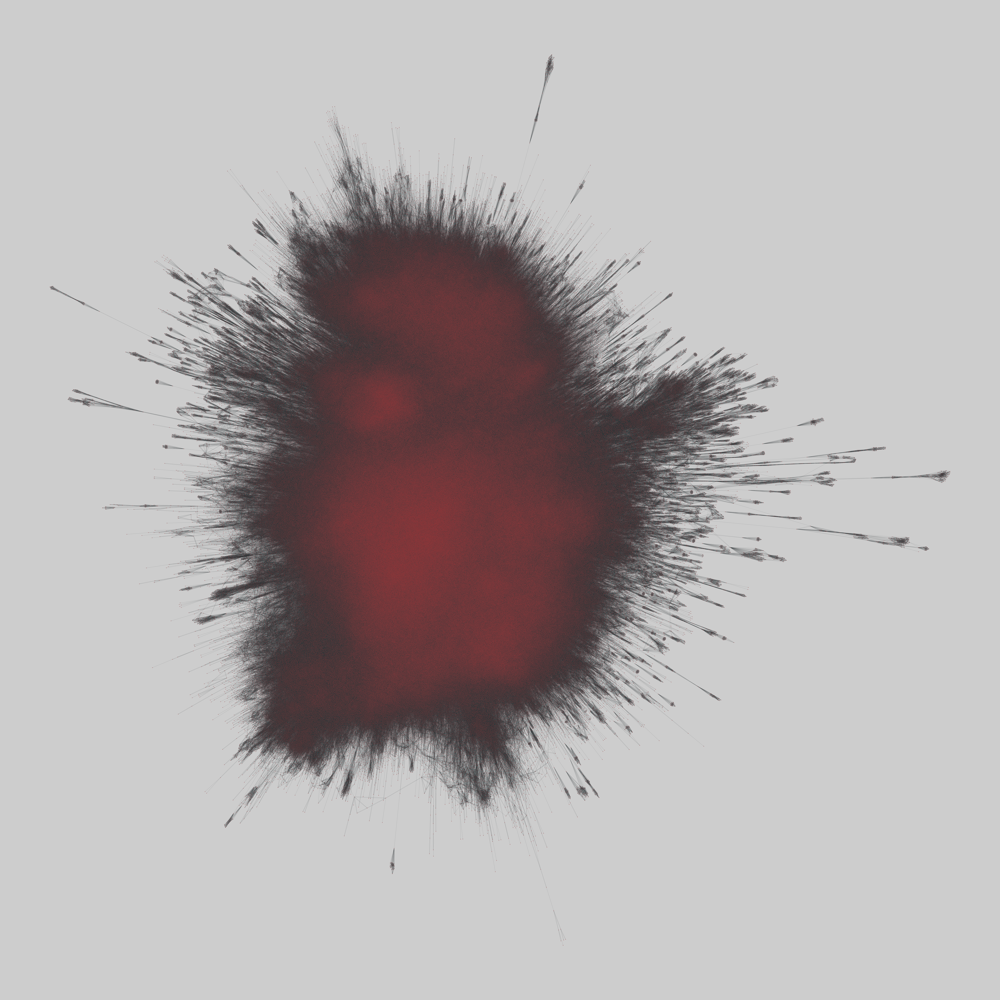
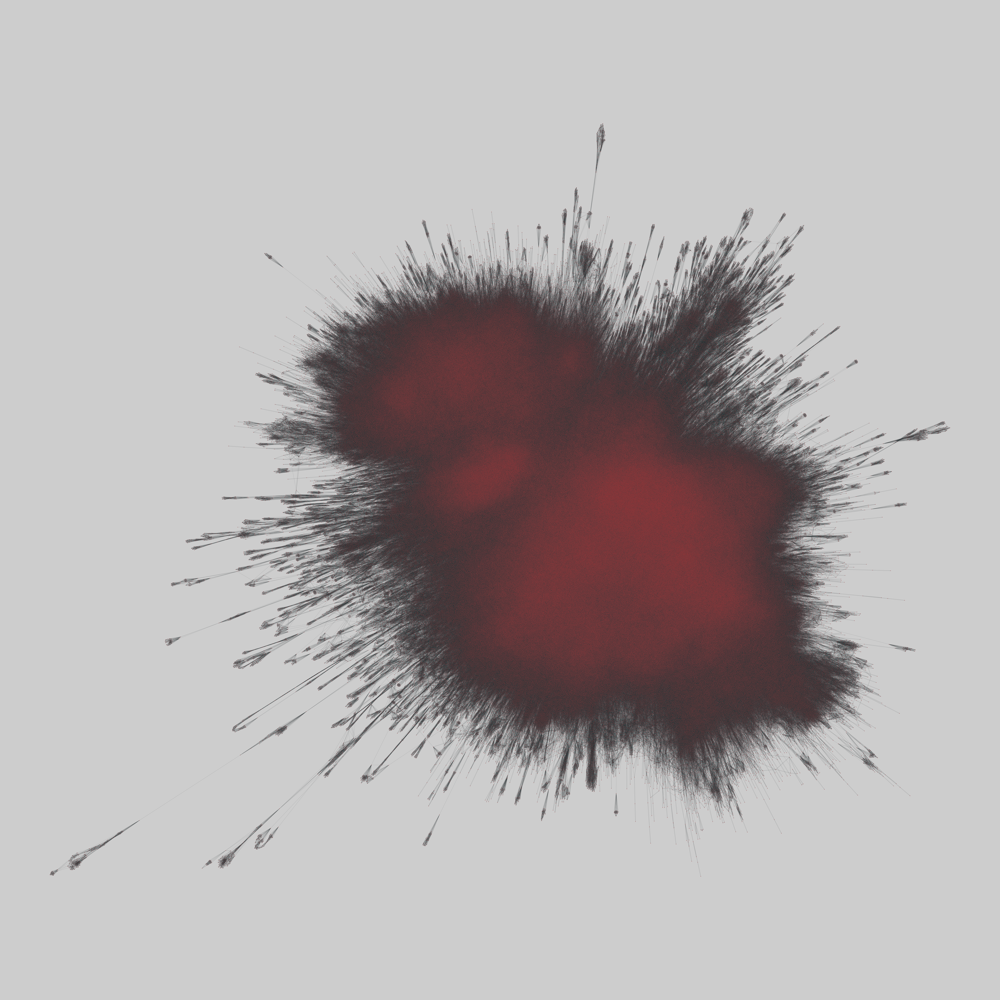
Networks of products sold on Amazon.com and their co-purchasing relations, collected by J. Leskovec, L. Adamic and B. Huberman by crawling the Amazon website in 2003. The data are based on the "Customers Who Bought This Item Also Bought" feature of the product pages: a directed edge $i \to j$ means that product $j$ is listed on the page of product $i$ as frequently co-purchased with it. Nodes are products (e.g. books, music CDs, DVDs and VHS video tapes).
There are four snapshots, crawled on different dates:
302: March 2, 2003 (at most 5 out-edges per product);312: March 12, 2003;505: May 5, 2003;601: June 1, 2003.
In the last three snapshots each product has at most 10 out-edges. Node identifiers are not consistent across snapshots, and the networks have no node or edge properties.
- Tags
- Economic Commerce Unweighted
- Citation
-
- J. Leskovec, L. Adamic and B. Huberman. "The Dynamics of Viral Marketing." ACM Transactions on the Web (ACM TWEB), 1 (2007) 10.1145/1232722.1232727 Sci-Hub
- Upstream URL OK
-
https://snap.stanford.edu/data/amazon0302.html
https://snap.stanford.edu/data/amazon0312.html
https://snap.stanford.edu/data/amazon0505.html
https://snap.stanford.edu/data/amazon0601.html - Networks
-
Tip: click on a column header to sort the list, or hover over it for a description.
Column legend
- $\left<k\right>$
- Mean degree
- $\sigma_k$
- Standard deviation of the degrees
- $\lambda_h$
- Largest eigenvalue of the Hashimoto (non-backtracking) matrix
- $\tau$
- Random walk mixing time
- $r$
- Degree assortativity
- $c$
- Global clustering coefficient
- $\oslash$
- (Pseudo-) diameter
- $S$
- Relative size of the largest component
- NPs
- Node properties
- EPs
- Edge properties
Name Nodes Edges $\left<k\right>$ $\sigma_k$ $\lambda_h$ $\tau$ $r$ $c$ $\oslash$ $S$ Kind Mode NPs EPs gt GraphML GML csv 302 262,111 1,234,877 4.71 5.92 17.80 3944.33 -0.00 0.31 38 1.00 Directed Unipartite 6.1 MiB 9.7 MiB 9.4 MiB 8.5 MiB 312 400,727 3,200,440 7.99 15.83 35.03 895.79 -0.02 0.25 20 1.00 Directed Unipartite 10.9 MiB 18.8 MiB 18.7 MiB 17.0 MiB 505 410,236 3,356,824 8.18 16.30 40.36 1805.09 -0.01 0.25 22 1.00 Directed Unipartite 11.3 MiB 19.7 MiB 19.6 MiB 17.4 MiB 601 403,394 3,387,388 8.40 16.15 40.31 3656.50 -0.01 0.26 25 1.00 Directed Unipartite 11.2 MiB 19.5 MiB 19.3 MiB 17.5 MiB - Ridiculograms*