interactome_pdz — PDZ-domain interactome (2005)
- Description
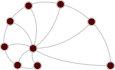
A network of protein–protein interactions mediated by PDZ domains, from PDZBase, a manually curated database of PDZ-domain-mediated interactions extracted from the literature (about 300 interactions from over 200 articles at the time of publication). The data are a version of PDZBase obtained from the network collection of the Ma'ayan Laboratory (Mount Sinai School of Medicine). Nodes are proteins, identified by their gene symbols, and an edge represents a binding interaction between a PDZ-domain-containing protein and its partner. All interactions are of type "Binding" with neutral effect. Self-loops denote proteins that bind to themselves.
The network has the following properties:
- (Node)
name: the gene symbol. - (Node)
uniprot_humananduniprot_mouse: the Swiss-Prot/UniProt accessions of the human and mouse proteins (empty if not available). - (Node)
type: the molecule types assigned to the protein (e.g. Adapter, Kinase, Receptor, Channel). - (Node)
location: its cellular localizations (Cytosol, Membrane, Extracellular, Vesicles). A few proteins are assigned different types or locations in different interactions, hence the last two are lists. - (Edge)
pubmed: the PubMed ID of the article reporting the interaction.
- (Node)
- Tags
- Biological Protein interactions Unweighted Metadata
- Added
- 2020-08-11
- Citation
-
- T. Beuming, L. Skrabanek, M. Y. Niv, P. Mukherjee, H. Weinstein, "PDZBase: a protein–protein interaction database for PDZ-domains." Bioinformatics 21(6), 827-828 (2005) 10.1093/bioinformatics/bti098 Sci-Hub
- Upstream URL OK
- https://web.archive.org/web/20180916202441/http://research.mssm.edu/maayan/datasets/qualitative_networks.shtml
- Networks
-
Tip: hover over a column header for a description.
Column legend
- $\left<k\right>$
- Mean degree
- $\sigma_k$
- Standard deviation of the degrees
- $\lambda_h$
- Largest eigenvalue of the Hashimoto (non-backtracking) matrix
- $\tau$
- Random walk mixing time
- $r$
- Degree assortativity
- $c$
- Global clustering coefficient
- $\oslash$
- (Pseudo-) diameter
- $S$
- Relative size of the largest component
- NPs
- Node properties
- EPs
- Edge properties
- Ridiculograms*
-