knoke_bureaucracies — Knoke bureaucracies (1978)
- Description
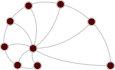
Exchange relations among ten organizations in the political economy of Indianapolis (USA). In 1978, D. Knoke and J. Wood collected data from workers at 95 organizations in Indianapolis, who indicated with which other organizations their own organization had any of 13 different types of relationships; D. Knoke and J. Kuklinski selected a subset of 10 organizations and two relationships. A directed edge points from an organization to another to which it sends information or money.
information: information exchange (KNOKI).money: money exchange (KNOKM).
The networks have the following properties:
- (Node)
name: the abbreviation of the organization (COUN: county government, COMM: chamber of commerce, EDUC: board of education, INDU: industrial development agency, MAYR: mayor's office, WRO: welfare rights organization, NEWS: newspaper, UWAY: United Way, WELF: welfare department, WEST: West Side community organization). - (Node)
sector: the sector of the organization (1: government, 2: voluntary, 3: private).
- Tags
- Social Offline Unweighted Metadata
- Added
- 2026-10-25
- Citation
-
- D. Knoke, J. R. Wood, "Organized for Action: Commitment in Voluntary Associations." Rutgers University Press, New Brunswick, NJ (1981) web.archive.org
- D. Knoke, J. H. Kuklinski, "Network Analysis." Sage, Beverly Hills, CA (1982) web.archive.org
- S. P. Borgatti, M. G. Everett, L. C. Freeman, "UCINET for Windows: Software for Social Network Analysis." Analytic Technologies, Harvard, MA (2002) web.archive.org
- Upstream URL OK
- https://web.archive.org/web/20020312110633/http://vlado.fmf.uni-lj.si/pub/networks/data/UciNet/UciData.htm
- Networks
-
Tip: click on a column header to sort the list, or hover over it for a description.
Column legend
- $\left<k\right>$
- Mean degree
- $\sigma_k$
- Standard deviation of the degrees
- $\lambda_h$
- Largest eigenvalue of the Hashimoto (non-backtracking) matrix
- $\tau$
- Random walk mixing time
- $r$
- Degree assortativity
- $c$
- Global clustering coefficient
- $\oslash$
- (Pseudo-) diameter
- $S$
- Relative size of the largest component
- NPs
- Node properties
- EPs
- Edge properties
Name Nodes Edges $\left<k\right>$ $\sigma_k$ $\lambda_h$ $\tau$ $r$ $c$ $\oslash$ $S$ Kind Mode NPs EPs gt GraphML GML csv information 10 49 4.90 3.46 5.72 0.84 -0.23 0.72 2 1.00 Directed Unipartite name sector 1 KiB 1 KiB 1 KiB 1 KiB money 10 22 2.20 2.15 3.98 1.22 -0.16 0.63 3 0.90 Directed Unipartite name sector 1 KiB 1 KiB 1 KiB 1 KiB - Ridiculograms*