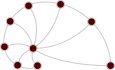
montreal — Montreal street gangs (2007)
- Description
Network of relationships among 35 street gangs active in Montreal, Canada, studied by K. Descormiers and C. Morselli. The data were collected in 2007 through focus group interviews with 20 male youth gang members (aged 14 to 18) residing in the Centre jeunesse de Montréal–Institut universitaire, the city's main youth correctional institution, who identified the active gangs and the relations among them. Nodes are gangs and an edge indicates that a relationship between two gangs was reported. The relations studied by the authors are both alliances and conflicts, but the data, as reconstructed from the article and distributed with UCINET, are binary and do not distinguish between them; the original network is directed, but the distributed version is undirected.
The network has the following properties:
- (Node)
name: the name of the gang. - (Node)
Allegiances: the gang coalition, with 1 = Bloods, 2 = Crips, 3 = other. - (Node)
Ethnicity: the main ethnicity of the gang, with 1 = Hispanic, 2 = Afro-Canadian, 3 = Caucasian, 4 = Asian, 5 = no main association or mixed. - (Node)
Territories: the territory of the gang, with 1 = downtown, 2 = east, 3 = west.
In all attributes, missing data are coded as 99.
- (Node)
- Tags
- Social Affiliation Unweighted
- Added
- 2020-08-11
- Citation
-
- K. Descormiers, and C. Morselli, "Alliances, conflicts, and contradictions in Montreal’s street gang landscape." International Criminal Justice Review 21(3), 297-314 (2011) 10.1177/1057567711418501 Sci-Hub
- Upstream URL OK
- https://web.archive.org/web/20210225172255/https://sites.google.com/site/ucinetsoftware/datasets/covert-networks/montrealstreetgangs
- Networks
-
Tip: hover over a column header for a description.
Column legend
- $\left<k\right>$
- Mean degree
- $\sigma_k$
- Standard deviation of the degrees
- $\lambda_h$
- Largest eigenvalue of the Hashimoto (non-backtracking) matrix
- $\tau$
- Random walk mixing time
- $r$
- Degree assortativity
- $c$
- Global clustering coefficient
- $\oslash$
- (Pseudo-) diameter
- $S$
- Relative size of the largest component
- NPs
- Node properties
- EPs
- Edge properties
- Ridiculograms*
-