packet_delays — Internet packet delays (2002)
- Description
Measurements of the difference in delay experienced by packet probes sent over the Internet, from an experiment conducted by M. Coates and collaborators during a short period in 2001, from a desktop computer in the ECE department at Rice University to similar machines at ten university locations. The data were collected to test a method for inferring the topology of the Internet routing tree from end-to-end measurements, and are distributed with the book "Statistical Analysis of Network Data" by E. D. Kolaczyk.
Each probe consisted of two small packets, separated by one large packet: both small packets were sent to the same destination, while the large packet was sent to a different (or the same) destination. The difference in delay between the two small packets, caused by the large packet queueing in front of the second small packet, indicates how much of the path the two destinations share.
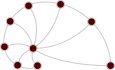
Nodes are the ten destination hosts: 1 = Instituto Superior Técnico (Portugal), 2 = Instituto de Telecomunicações (Portugal), 3 = University of California, Berkeley, 4 and 5 = Michigan State University (hosts 1 and 2), 6 = University of Illinois, Urbana-Champaign, 7 and 8 = University of Wisconsin, Madison (hosts 1 and 2), 9 and 10 = Rice University (hosts 1 and 2). Each probe is a directed edge from the destination of the small packets to the destination of the large packet, so the network is a multigraph with self-loops, where each ordered pair of destinations is connected by between 57 and 125 edges.
The network has the following properties:
- (Node)
name: the destination number, from 1 to 10. - (Edge)
delay: the difference in delay of the two small packets of the probe, in milliseconds (as stated in the source documentation).
- (Node)
- Tags
- Technological Communication Weighted
- Added
- 2020-08-12
- Citation
-
- M. Coates et al., "Maximum likelihood network topology identification from edge-based unicast measurements." ACM SIGMETRICS Performance Evaluation Review 30(1), 11-20 (2002) 10.1145/511399.511337 Sci-Hub
- Upstream URL OK
- http://math.bu.edu/people/kolaczyk/datasets.html
- Networks
-
Tip: hover over a column header for a description.
Column legend
- $\left<k\right>$
- Mean degree
- $\sigma_k$
- Standard deviation of the degrees
- $\lambda_h$
- Largest eigenvalue of the Hashimoto (non-backtracking) matrix
- $\tau$
- Random walk mixing time
- $r$
- Degree assortativity
- $c$
- Global clustering coefficient
- $\oslash$
- (Pseudo-) diameter
- $S$
- Relative size of the largest component
- NPs
- Node properties
- EPs
- Edge properties
- Ridiculograms*
-