amazon_coauthor_shchur — Amazon co-purchases and Microsoft Academic co-authorships (Shchur et al., 2018)
- Description
Four networks introduced by Shchur et al. as benchmarks for node classification, as distributed in their repository:
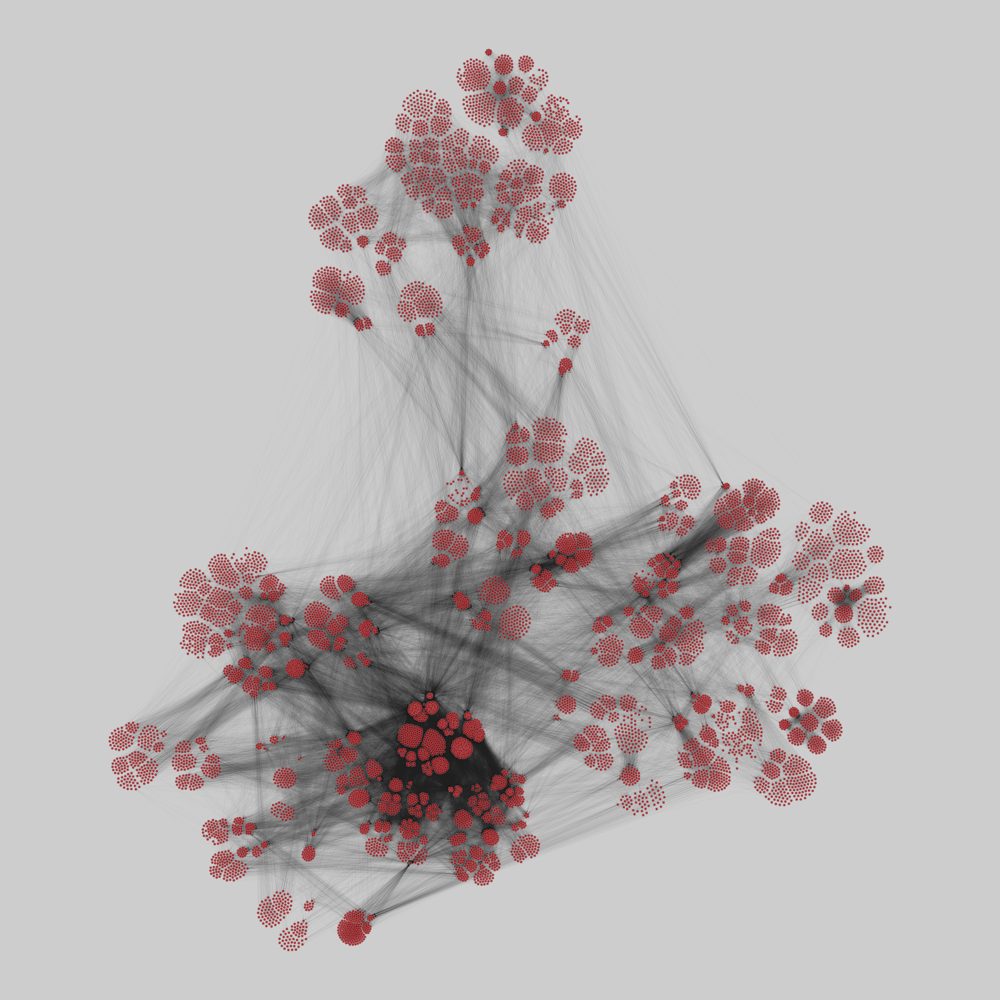
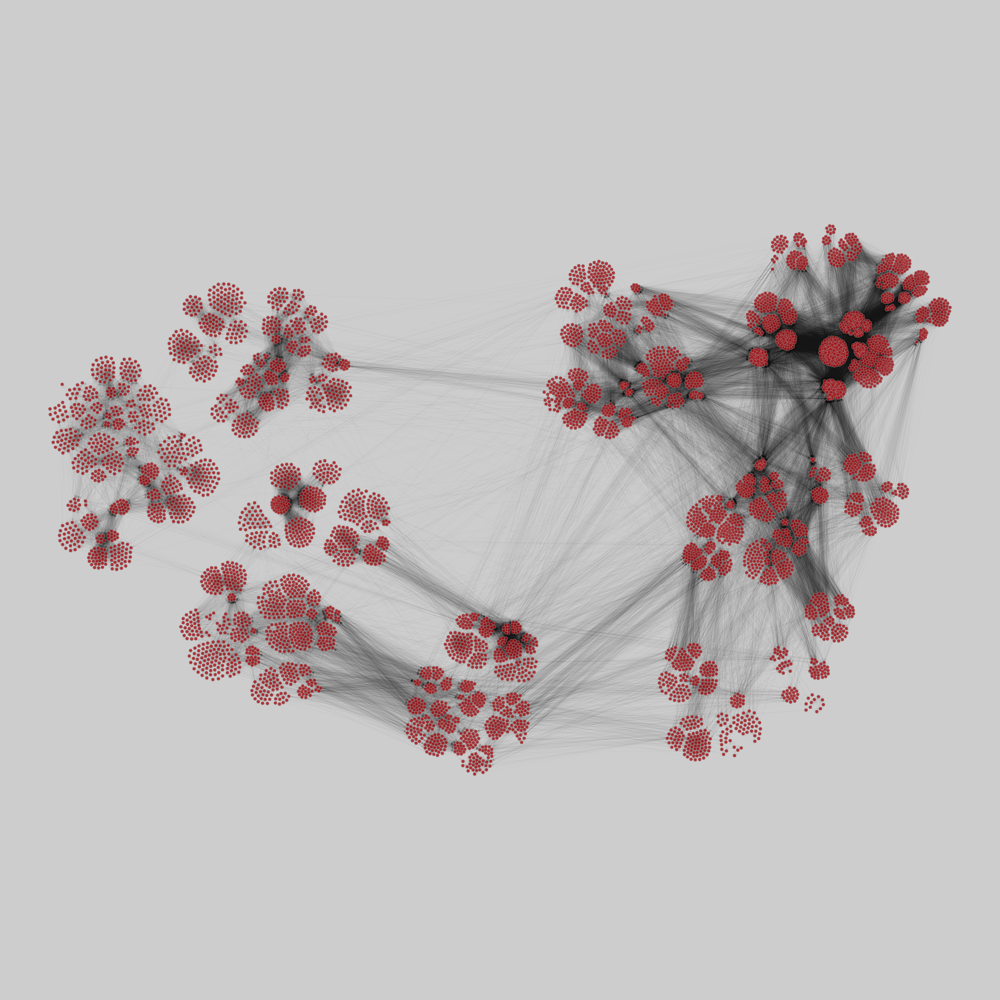
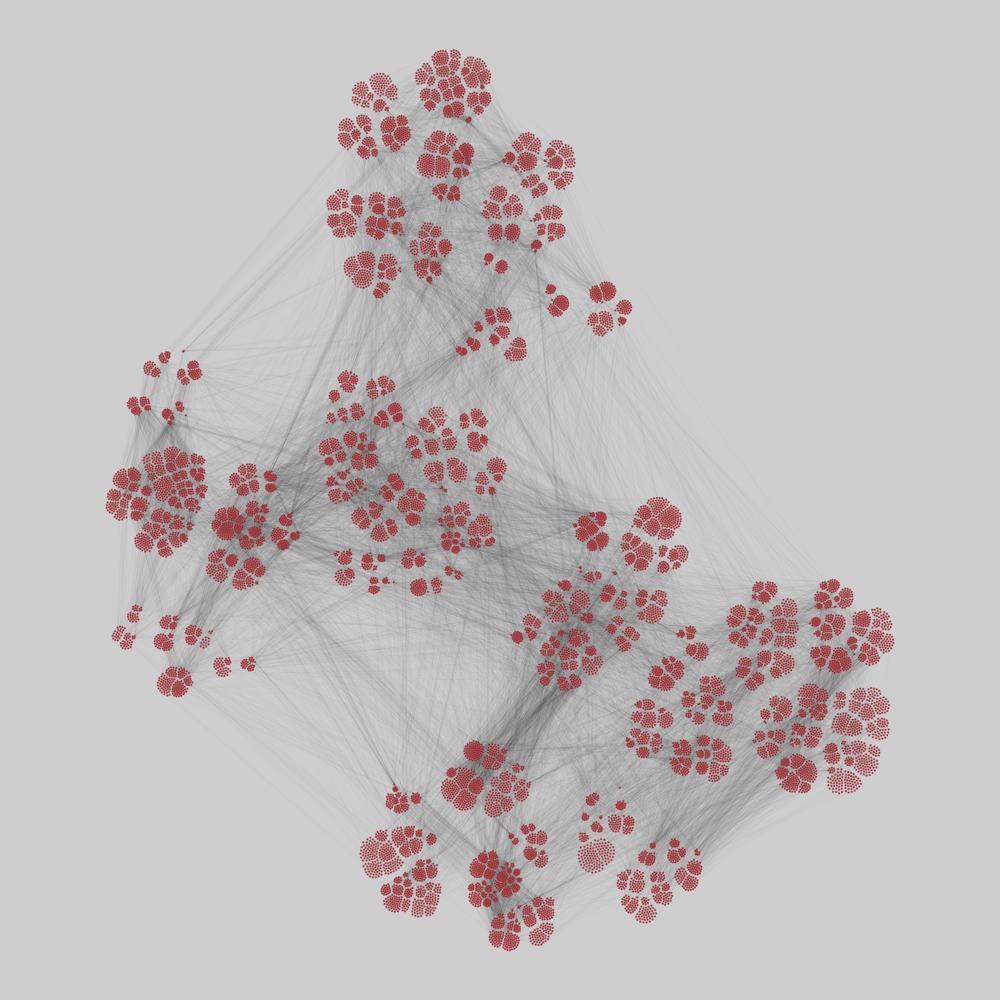
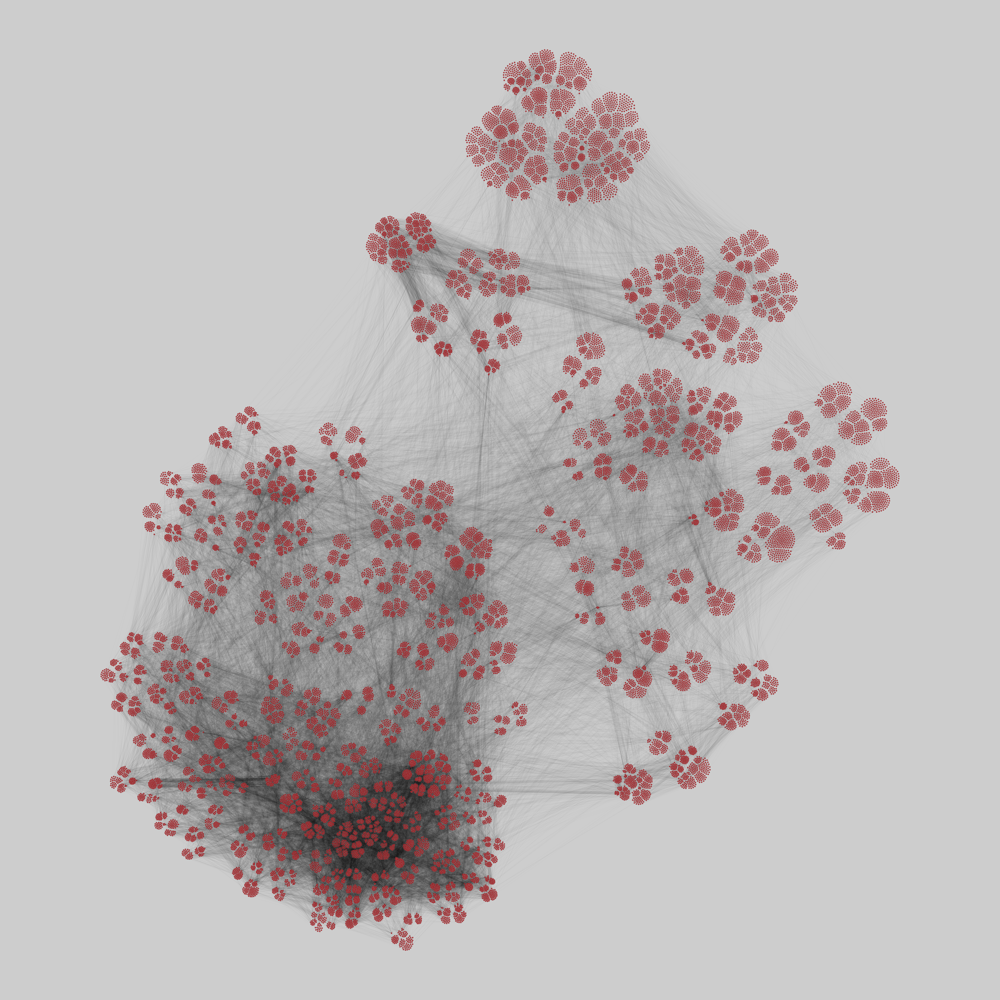
amazon_computersandamazon_photo: products of the categories "Computers" and "Camera & Photo" of Amazon, from the Amazon product data of McAuley et al. (2015). A directed edge from product A to product B means that B is listed among the products frequently bought together with A (the relation is not symmetric in the data: about a third of the pairs are listed in both directions, and there is one self-loop inamazon_photo). Each product is labeled with its subcategory (e.g. "Laptops" or "Lenses").coauthor_csandcoauthor_physics: authors of papers in computer science and in physics, from the Microsoft Academic Graph of the KDD Cup 2016 challenge. Two authors are connected by an undirected edge if they co-authored a paper. Each author is described by the keywords of their papers, and labeled with their most active field of study (forcoauthor_physics, the journal of the Physical Review in which they publish most).
The benchmarks use only the largest connected component of each network (treating the edges as undirected), but the files include all the nodes, which are kept here. The node features of the Amazon networks (bag-of-words encodings of the product reviews, without the words) are left out, as are the product identifiers, which are not given.
The networks have the following properties:
category(Amazon networks): the subcategory of the product.mag_id(co-authorship networks): the identifier of the author in the Microsoft Academic Graph (in hexadecimal, as given).field(co-authorship networks): the most active field of study of the author (forcoauthor_physics, a journal, e.g.phys rev b).keywords(co-authorship networks): the keywords of the author's papers.keyword_counts(co-authorship networks): the count given for each keyword inkeywords(presumably the number of the author's papers with that keyword).
- Tags
- Economic Commerce Social Collaboration Unweighted Metadata
- Citation
-
- O. Shchur, M. Mumme, A. Bojchevski, S. Günnemann, "Pitfalls of Graph Neural Network Evaluation." Relational Representation Learning Workshop (R2L 2018), NeurIPS 2018 (2018) 10.48550/arXiv.1811.05868 Sci-Hub
- J. McAuley, C. Targett, Q. Shi, A. van den Hengel, "Image-based recommendations on styles and substitutes." Proceedings of the 38th International ACM SIGIR Conference on Research and Development in Information Retrieval, 43-52 (2015) 10.1145/2766462.2767755 Sci-Hub
- Upstream URL OK
- https://github.com/shchur/gnn-benchmark
- Upstream license
- MIT, https://github.com/shchur/gnn-benchmark/blob/1e72912a0810cdf27ae54fd589a3b43358a2b161/LICENSE
- Networks
-
Tip: click on a column header to sort the list, or hover over it for a description.
Column legend
- $\left<k\right>$
- Mean degree
- $\sigma_k$
- Standard deviation of the degrees
- $\lambda_h$
- Largest eigenvalue of the Hashimoto (non-backtracking) matrix
- $\tau$
- Random walk mixing time
- $r$
- Degree assortativity
- $c$
- Global clustering coefficient
- $\oslash$
- (Pseudo-) diameter
- $S$
- Relative size of the largest component
- NPs
- Node properties
- EPs
- Edge properties
Name Nodes Edges $\left<k\right>$ $\sigma_k$ $\lambda_h$ $\tau$ $r$ $c$ $\oslash$ $S$ Kind Mode NPs EPs gt GraphML GML csv amazon_computers 13,752 287,209 20.88 76.58 166.10 92.03 -0.04 0.14 10 0.97 Directed Unipartite category 628 KiB 1.3 MiB 1.3 MiB 1.2 MiB amazon_photo 7,650 143,663 18.78 54.13 119.96 718.23 -0.01 0.23 11 0.98 Directed Unipartite category 313 KiB 651 KiB 628 KiB 590 KiB coauthor_cs 18,333 81,894 8.93 9.11 22.75 242.43 0.11 0.18 24 1.00 Undirected Unipartite mag_id field keywords keyword_counts 2.6 MiB 2.9 MiB 2.8 MiB 4.9 MiB coauthor_physics 34,493 247,962 14.38 15.57 49.23 63.29 0.20 0.19 17 1.00 Undirected Unipartite mag_id field keywords keyword_counts 3.2 MiB 3.9 MiB 3.9 MiB 5.7 MiB - Ridiculograms*