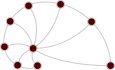
new_zealand_collab — New Zealand scientific collaborations (2015)
- Description
Network of scientific collaborations among New Zealand institutions, constructed by S. Aref, D. Friggens and S. Hendy from a full extract of the Scopus bibliographic database, restricted to New Zealand publications from 2010 to 2015. Scopus affiliation IDs were grouped into institutions (universities, Crown Research Institutes, government agencies, district health boards, companies, non-profit organizations, etc.) using a manually compiled mapping of the New Zealand Ministry of Business, Innovation and Employment (MBIE); affiliations that were missing or not identifiable as specific institutions were excluded.
Nodes are institutions, and two institutions are connected if they have at least one joint publication, i.e. a publication with authors affiliated with each of them (an author with affiliations to both institutions does not count as a collaboration). The edges are weighted by the number of joint publications.
In the study, institutions were classified into four categories (business enterprise, private not-for-profit, government, and higher education), but this classification is not included in the data used here.
The network has the following properties:
- (Node)
_graphml_vertex_id: the name of the institution. - (Edge)
weight: the number of joint publications of the two institutions between 2010 and 2015.
- (Node)
- Tags
- Social Collaboration Weighted
- Added
- 2020-08-11
- Citation
-
- S. Aref, D. Friggens, and S. Hendy, "Analysing scientific collaborations of New Zealand institutions using Scopus bibliometric data." Proc. Australasian Comp. Sci. Week Multiconf. (ACSW ’18), Article 49, 1-10 (2018) 10.1145/3167918.3167920 Sci-Hub
- Upstream URL 403
- https://doi.org/10.6084/m9.figshare.5705167
- Networks
-
Tip: hover over a column header for a description.
Column legend
- $\left<k\right>$
- Mean degree
- $\sigma_k$
- Standard deviation of the degrees
- $\lambda_h$
- Largest eigenvalue of the Hashimoto (non-backtracking) matrix
- $\tau$
- Random walk mixing time
- $r$
- Degree assortativity
- $c$
- Global clustering coefficient
- $\oslash$
- (Pseudo-) diameter
- $S$
- Relative size of the largest component
- NPs
- Node properties
- EPs
- Edge properties
- Ridiculograms*
-