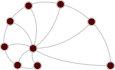
scn_functional_networks — Mouse suprachiasmatic nucleus functional networks (2016)
- Description
Functional networks between the neurons of the suprachiasmatic nucleus (SCN) of mice, the master circadian clock located in the hypothalamus, inferred by Abel et al. from single-cell bioluminescence recordings. Slices of the SCN of five mice expressing a bioluminescent reporter of the clock protein PERIOD2 (PER2::LUC) were imaged at a rate of one sample per hour, and the cells were tracked over time. The neurons were desynchronized by blocking their communication with the neurotoxin tetrodotoxin (TTX), which was then washed out, and the network was inferred from the bioluminescence traces of the individual cells while they resynchronized after the washout.
Two cells are connected if the maximal information coefficient (MIC) between their bioluminescence traces after the washout exceeds a threshold, which was chosen separately for each SCN (0.949, 0.935, 0.9895, 0.968 and 0.969 for SCNs 1 to 5, respectively), as given by the authors. Cells without any connection above the threshold are kept as isolated nodes.
scn1, ...,scn5: the functional networks of the five SCN slices.
The networks have the following properties:
- (Node)
pos: the (x, y) location of the cell in the image. - (Node)
bioluminescence: the time series of the bioluminescence of the cell during the TTX washout, with one sample per hour. - (Edge)
mic: the maximal information coefficient between the two cells.
- Tags
- Biological Connectome Weighted Metadata
- Added
- 2026-10-25
- Citation
-
- J. H. Abel, K. Meeker, D. Granados-Fuentes, P. C. St. John, T. J. Wang, B. B. Bales, F. J. Doyle, E. D. Herzog, L. R. Petzold, "Functional network inference of the suprachiasmatic nucleus." Proceedings of the National Academy of Sciences 113(16), 4512-4517 (2016) 10.1073/pnas.1521178113 Sci-Hub
- Upstream URL OK
- https://github.com/JohnAbel/scn-resynchronization-data-2016
- Networks
-
Tip: click on a column header to sort the list, or hover over it for a description.
Column legend
- $\left<k\right>$
- Mean degree
- $\sigma_k$
- Standard deviation of the degrees
- $\lambda_h$
- Largest eigenvalue of the Hashimoto (non-backtracking) matrix
- $\tau$
- Random walk mixing time
- $r$
- Degree assortativity
- $c$
- Global clustering coefficient
- $\oslash$
- (Pseudo-) diameter
- $S$
- Relative size of the largest component
- NPs
- Node properties
- EPs
- Edge properties
Name Nodes Edges $\left<k\right>$ $\sigma_k$ $\lambda_h$ $\tau$ $r$ $c$ $\oslash$ $S$ Kind Mode NPs EPs gt GraphML GML csv scn1 541 1,686 6.23 7.46 17.87 54.09 0.37 0.36 14 0.70 Undirected Unipartite pos bioluminescence mic 775 KiB 805 KiB 804 KiB 493 KiB scn2 404 1,033 5.11 7.26 17.99 26.27 0.28 0.37 10 0.56 Undirected Unipartite pos bioluminescence mic 723 KiB 733 KiB 731 KiB 434 KiB scn3 430 724 3.37 5.97 15.23 22.36 0.33 0.37 14 0.42 Undirected Unipartite pos bioluminescence mic 778 KiB 798 KiB 797 KiB 500 KiB scn4 350 747 4.27 7.47 17.56 19.50 0.14 0.35 9 0.44 Undirected Unipartite pos bioluminescence mic 675 KiB 675 KiB 674 KiB 328 KiB scn5 358 805 4.50 7.13 17.65 20.59 0.28 0.39 8 0.49 Undirected Unipartite pos bioluminescence mic 554 KiB 565 KiB 564 KiB 367 KiB - Ridiculograms*