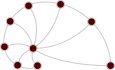
windsurfers — Windsurfers network (1986)
- Description
Interpersonal contacts among 43 windsurfers on a beach in southern California, studied by L. C. Freeman, S. C. Freeman and A. G. Michaelson in the fall of 1986. The windsurfing community was fairly clearly divided into at least two sub-communities, whose members tended to limit their interactions to fellow group members. The 43 individuals were observed for 31 days, and all interpersonal contacts among them were recorded. After the end of the observations, all of them were interviewed about their perception of social affiliations: each subject performed a sequence of card sorting tasks that assigned an index of the perceived closeness of every individual on the beach to each of the other individuals. The data were distributed by L. C. Freeman on his network data page at the University of California, Irvine (no longer online), from which this version was obtained via the Internet Archive.
The two relations are given as separate networks, with the same nodes in the same order:
interaction: an undirected edge (i, j) indicates that individuals i and j were observed interacting. (In the source matrix, the row of the last individual is empty, although the corresponding column is not; the matrix is symmetrized here.)closeness: an undirected edge (i, j) indicates a nonzero perceived closeness between i and j, as aggregated in the source matrix (how the closeness indices of the different subjects were combined is not documented). This network is almost complete.
The networks have the following properties:
- (Node)
diagonal(interaction): the diagonal entry of the interaction matrix (its meaning is not documented). - (Edge)
weight(interaction): the number of observed interactions. - (Edge)
weight(closeness): the perceived closeness (between 0.333 and 1).
- Tags
- Social Offline Weighted Metadata
- Added
- 2020-08-11
- Citation
-
- L. Freeman, S. Freeman, & A. Michaelson, "On human social intelligence." J. Social and Biological Structures 11(4), 415-425 (1988) 10.1016/0140-1750(88)90080-2 Sci-Hub
- L. C. Freeman, S. C. Freeman, A. G. Michaelson, "How humans see social groups: A test of the Sailer-Gaulin models." Journal of Quantitative Anthropology 1, 229-238 (1989) scholar.google.com
- Upstream URL OK
- https://web.archive.org/web/20210115130726/http://moreno.ss.uci.edu/data.html#beach
- Networks
-
Tip: click on a column header to sort the list, or hover over it for a description.
Column legend
- $\left<k\right>$
- Mean degree
- $\sigma_k$
- Standard deviation of the degrees
- $\lambda_h$
- Largest eigenvalue of the Hashimoto (non-backtracking) matrix
- $\tau$
- Random walk mixing time
- $r$
- Degree assortativity
- $c$
- Global clustering coefficient
- $\oslash$
- (Pseudo-) diameter
- $S$
- Relative size of the largest component
- NPs
- Node properties
- EPs
- Edge properties
Name Nodes Edges $\left<k\right>$ $\sigma_k$ $\lambda_h$ $\tau$ $r$ $c$ $\oslash$ $S$ Kind Mode NPs EPs gt GraphML GML csv interaction 43 336 15.63 6.53 17.00 2.34 -0.15 0.56 3 1.00 Undirected Unipartite diagonal weight 2 KiB 3 KiB 3 KiB 3 KiB closeness 43 897 41.72 0.79 40.73 0.30 -0.08 0.99 2 1.00 Undirected Unipartite weight 4 KiB 7 KiB 7 KiB 5 KiB - Ridiculograms*